
Most of the time breaking into a program you're debugging is easy. Just load the project in your IDE of choice, set your breakpoint, and run. But what happens when you can't run your program via the IDE? Its sometimes hard to do for things like providers and services that cannot be directly executed by the development environment or that require complex setups or mock frameworks in order to host for debugging. Or something.
Anyhow, there's a simple way to force a program to break, ask to have a debugger attach to the process, and then break for debugging. Here's the code:
#if DEBUG
if (!System.Diagnostics.Debugger.IsAttached)
{
System.Diagnostics.Debugger.Launch();
}
System.Diagnostics.Debugger.Break();
#endif
The Debugger object has some lovely static methods that allow us to check and see if a debugger is attached, and if not, request one be attached. I could show you what the dialog looks like, but its about 1:30 Saturday morning and I'm 100% sober. Please, let my suffering end a little bit quicker.
Damnit, you friggin bastards. Okay. Here it is:
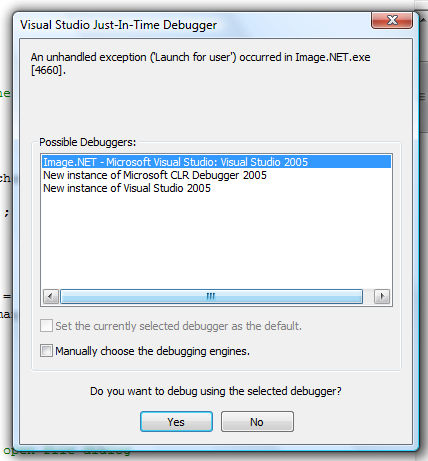
Right, so just pick the version of your IDE that has your source loaded and you're off and running. The Break() method acts just like a breakpoint. Oh, and wrapping these statements in the #if DEBUG #endif construct ensures that only the debug version will behave in this way. Cool.

-
 [blarg]
-
[blarg.left]
-
[blarg.right]
-
 [csharp]
-
[csharp.left]
-
[csharp.right]
-
 [horror]
-
[horror.left]
-
[horror.right]
-
 [wtmf.small]
-
 [wtmf.small.left]
-
[wtmf.small.right]
-
 [wtmf.large]
-
[wtmf.large.left]
-
[wtmf.large.right]
-
 [huh.small]
-
[huh.small.left]
-
[huh.small.right]
-
 [huh.large]
-
[huh.large.left]
-
[huh.large.right]
-
 [hate.small]
-
[hate.small.left]
-
[hate.small.right]
-
 [hate.large]
-
[hate.large.left]
-
[hate.large.right]